Guide
How Compound Interest Works
See how interest joins the balance, how compounding frequency affects growth, and why time changes the result more than it first appears.
Compound interest begins with a simple change: once interest is added to the balance, later interest is calculated on that larger amount. Repeating the step turns steady percentage growth into a curve. The sections below show the calculation, compare compounding frequencies and explain why the starting date can matter so much.
The mechanism: interest joins the base
Under simple interest, the base never changes: $10,000 at 6% earns $600 every year, forever, a straight line. Under compound interest, the base absorbs each credit and grows. Watch the first three years of $10,000 at 6%, compounded yearly:
| Year | Base at start | Interest earned (6%) | Balance at end |
|---|---|---|---|
| 1 | $10,000.00 | $600.00 | $10,600.00 |
| 2 | $10,600.00 | $636.00 | $11,236.00 |
| 3 | $11,236.00 | $674.16 | $11,910.16 |
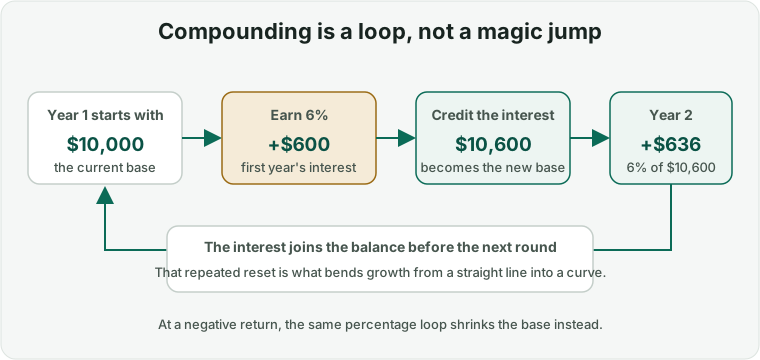
Year two's extra $36 is 6% earned on year one's $600: interest on interest, the defining move. Each year's growth is a fixed percentage but a growing amount: the yearly interest itself grows 6% per year. Plotted, simple interest is a line; compound interest is a curve that pulls away from it, slowly at first, then unmistakably.
When I build or review a compounding example, I calculate the first two periods separately before trusting a 30- or 40-year result. If the new balance does not become the next period's base, the model is not compounding. A precise wrong answer is still wrong; it has merely dressed up as a spreadsheet.
Notice what this means: the gains come from crediting events. Between credits, nothing compounds. That's why the crediting frequency, how often interest is folded into the base, is a genuine variable in the outcome, and it's the first thing worth quantifying.
It's also worth being precise about what actually compounds. Bank deposits compound by contract: credited interest joins the balance automatically. Bonds mostly don't: a coupon paid to your account earns nothing further unless you reinvest it, which is why the same yield can produce very different outcomes depending on what happens to the payouts. Equity returns compound structurally (this year's growth builds on last year's prices, and reinvested dividends buy shares that generate their own dividends), but at a rate that's an average over volatile years rather than a promise. The arithmetic below applies to all three; only the certainty of the rate differs.
Frequency: measurable, but smaller than the marketing implies
Here is the same 6% nominal rate applied to $10,000 for 10 years, with the only change being how often interest is credited:
| Compounding | Value after 10 years | Effective annual rate |
|---|---|---|
| Yearly | $17,908.48 | 6.000% |
| Quarterly | $18,140.18 | 6.136% |
| Monthly | $18,193.97 | 6.168% |
| Daily | $18,220.29 | 6.183% |
Two honest readings of this table. First, frequency is real money: daily beats yearly by $311.81 on this example. Second, it saturates fast: the entire gap between monthly and daily compounding is $26.32 over ten years. Moving from yearly to quarterly captures most of the available benefit; beyond monthly, the differences are rounding-error territory. The saturation has a hard ceiling: push the frequency toward compounding every instant (the "continuous" limit) and this example tops out near $18,221.19, about 90 cents above daily compounding, after ten years. A bank advertising "daily compounding" is describing something worth about 0.015% per year over monthly; a 0.25% higher rate at a competitor beats it easily. Frequency is the least important of the three levers; rate and time do the actual work.
The effective annual rate in the right-hand column is what banks publish as APY (or AER in the UK). It states the true one-year growth with compounding folded in, which makes it the correct number for comparing accounts, regardless of how often each one credits interest.
The Rule of 72, tested against exact math
The Rule of 72 estimates doubling time: years to double ≈ 72 ÷ annual rate. It's worth knowing exactly how good this approximation is, so here it is against the exact answer (annual compounding):
| Rate | Rule of 72 says | Exact doubling time | Error |
|---|---|---|---|
| 2% | 36.0 years | 35.00 years | +1.0 year |
| 4% | 18.0 years | 17.67 years | +0.3 years |
| 6% | 12.0 years | 11.90 years | +0.1 years |
| 8% | 9.0 years | 9.01 years | −0.01 years |
| 12% | 6.0 years | 6.12 years | −0.1 years |
Between roughly 4% and 12% (the range where most savings and investment questions live) the rule is accurate to within a few weeks. Use it to sanity-check any calculator output: if a tool claims your money triples in 10 years at 6%, the rule (doubling alone takes ~12 years) tells you something's off before you check a single formula. For exact figures at any rate and frequency, the Compound Interest Calculator shows the year-by-year path, and the SEC's investor.gov compound interest calculator is a useful independent cross-check.
Compounding against you
The same mechanism runs in reverse on debt, and credit cards run it at high frequency: most compound daily. Carry $5,000 on a card at 24% APR with no payments, and after twelve months the balance is $6,355.74: the 24% nominal rate compounds daily into an effective 27.11% per year. (At monthly compounding it would be 26.82%, frequency again worth a little, rate worth a lot.)
The asymmetry with savings is stark: the same dollar might compound at a few percent in a savings account and at 25%+ on a card balance (illustrative figures — deposit and card rates move over time). Run the Rule of 72 on both directions: money saved at 4% doubles in about 18 years; a card balance at 27% effective doubles in under 3. That gap is why paying down high-rate debt delivers, mathematically, a certain interest saving equal to the card's rate — a comparison worked through in debt snowball vs debt avalanche.
Time asymmetry: the decade you can't buy back
Because the curve steepens with time, the early years of compounding are worth far more than they appear, and the cost of delay is larger than intuition suggests.
Start at 25 (40 years): $144,000 contributed grows to $787,444; $643,444 of it is growth.
Start at 35 (30 years): $108,000 contributed grows to $365,991; $257,991 of it is growth.
The ten-year delay cost $421,453 of outcome while saving only $36,000 of contributions. Sharper still: someone who contributes $300/month only from 25 to 35 and then stops (just $36,000 total) reaches about $421,453 at 65, beating the person who contributes $108,000 from 35 to 65. A third of the money, started ten years sooner, wins.
Read the 40-year run once more, from the other end: the same figures show the balance gaining $421,453 in its final ten years, more than everything it accumulated in the first thirty combined. The late years do the spectacular work, but only for money that was already in the machine; that's the sense in which the early decade is the one you can't buy back.
This is not a claim that markets return a smooth 7%. They don't, and real sequences of returns will land above or below. It's a statement about the shape of exponential growth: contributions made early sit on the steep part of the curve for decades, a principle the SEC's investor.gov saving basics sum up as small amounts adding up to big money over time. The trade-offs between investing early in a lump sum versus spreading contributions are examined in lump sum vs monthly investing.
Use an effective annual rate to compare frequencies
An effective annual rate converts a stated rate and compounding frequency into the percentage change over one year. For example, 5.9% compounded monthly produces an effective rate of about 6.06%, slightly above 6.0% compounded yearly. Make sure the figures use the same fee and tax basis before treating that conversion as a complete product comparison.
Taxes and fees reduce the amount left to compound, while inflation reduces what the future balance can buy. Compounding also assumes reinvestment: interest that is withdrawn no longer earns a return. Those details are easy to miss in a clean projection, so include them whenever they apply to the account or investment you are modeling.
Beginner questions about compounding
Do monthly contributions start compounding immediately?
Each contribution begins earning only after it is deposited, and the exact first period depends on whether the calculator models deposits at the start or end of a month. A contribution made today therefore has more time than one made next year. Check the tool's deposit-timing assumption before comparing its result with an account statement.
Does a 7% assumption mean I will earn 7% every year?
No. A calculator applies the rate smoothly because it needs one input, while real investment returns can be positive or negative and arrive in an uneven sequence. Use several plausible rates as scenarios, not a single rate as a promise. Guaranteed deposit rates are different, but their term, compounding and withdrawal conditions still matter.
Can compound interest work against me?
Yes. Unpaid borrowing costs can join a debt balance and generate further interest, which is the same loop with the direction reversed. Credit-card balances are a common example. Fees, taxes and inflation can also reduce the useful growth of savings even when the displayed balance rises.